
YouTube Watch History insights
This was eye-opening to see my data and see my habits in a new way
We all I spend hours on YouTube, and I knew that it was a bad habit. For a personal data exploration project, I decided to dive into my own YouTube watch history and transform that raw data into something meaningful and visual. The result is YouTube Watch History Insights, an interactive dashboard that reveals fascinating patterns and trends in my chronic content consumption!
Unlocking YouTube Data: From Raw History to Rich Insights
The first step was to get the data! YouTube doesn’t provide a way to download your watch history directly, but … I know how to use Inspect Element. With the network tab open, I scroll through the YouTube watch history page! Once I reach my desired ending date, I download all the network data as a JSON file from Chrome. Now, it’s just a massive, serialized JSON file and not easy to analyze directly.
The Summer2024 history is 55.6MB, which is 2,190,780 words of JSON. That’s a lot of data to process!
To manage these huge files, I turned to a trusty old friend, jq 1 . It’s a command-line JSON processor that makes it easy to extract and transform data. I used it to filter the JSON to include only the data I wanted, then piped it into a new file. This was a huge win, as I was able to work with the data in a more manageable format. This is the jq 1 command I tediously constructed to get the data I needed:
jq '
 .log.entries[]
 | select(.request.url | contains("/data/batchexecute"))
 | .response.content.text
 | @base64d
 | split("\n")[3]
 | fromjson[0][2]
 | fromjson[0]
 | .[]?
 | {
 timestamp:     .[4],
 title:         .[9][0],
 isSearch:      .[9][1],
 url:           .[9][3],
 watchedAt:     .[12]?[0],
 platform:      ([.[19]] | flatten),
 thumbnail:     .[23][0],
 duration:      .[23][1],
 adSource:      .[25]?[0]?[0],
 channelName:   .[32]?[0]?[1],
 channelUrl:    .[32]?[0]?[3]
 }
' -c myactivity.google.com.har | jq -s -c > out.txt
To give you a glimpse as to what the input data looks like, here’s a sample of what the video data looks like:
[
	null,
	null,
	null,
	[26],
	1736129665229291,
	"AODP23YAAAAjUiEIHRCAgJywjt6KAxj_v_me0OCKAzoLCLKBmdz2sqfa7QFhd__uHLO57_1WP_oFLMKL43-ygw",
	"AODP23YAAAATChEIzQEQl9uUJBjrw-v_guCKA835DEJBJPs2MEBn1G2W_lzkMDCh",
	["YouTube", null, "https://www.gstatic.com/images/branding/product/2x/youtube_2024_q4_24dp.png"],
	null,
	[
		"Full video out now! #airsoft #shorts #memes #fyp #fail",
		null,
		"Watched",
		"https://www.youtube.com/watch?v=7bSdl2uGQLI"
	],
	null,
	null,
	null,
	null,
	null,
	null,
	null,
	[""],
	["YouTube", null, "https://www.gstatic.com/images/branding/product/2x/youtube_2024_q4_24dp.png"],
	[["iOS"]],
	null,
	null,
	null,
	["https://i.ytimg.com/vi/7bSdl2uGQLI/mqdefault.jpg", "0:16", 10],
	null,
	null,
	null,
	[[4, "YouTube watch history"]],
	[[26, "YouTube"]],
	null,
	null,
	null,
	[[null, "Mr. Pew", null, "https://www.youtube.com/channel/UC5WOnJ7Z05NM7lbGf2rimig"]]
]
This command turns the raw JSON into a more manageable format, ready for use in the next step. It pulls out key information, such as the video’s title, duration, and the timestamp of when it was watched.
The Summer2024 history after processing is 6.9MB, which is 130,471 words. Much better!
Key Visualizations: Unveiling Viewing Patterns
The heart of the project is the interactive dashboard, built with React 2 and Recharts 3 , which transforms the complex data into a series of easy-to-understand visualizations. Here are some of the key insights it reveals:
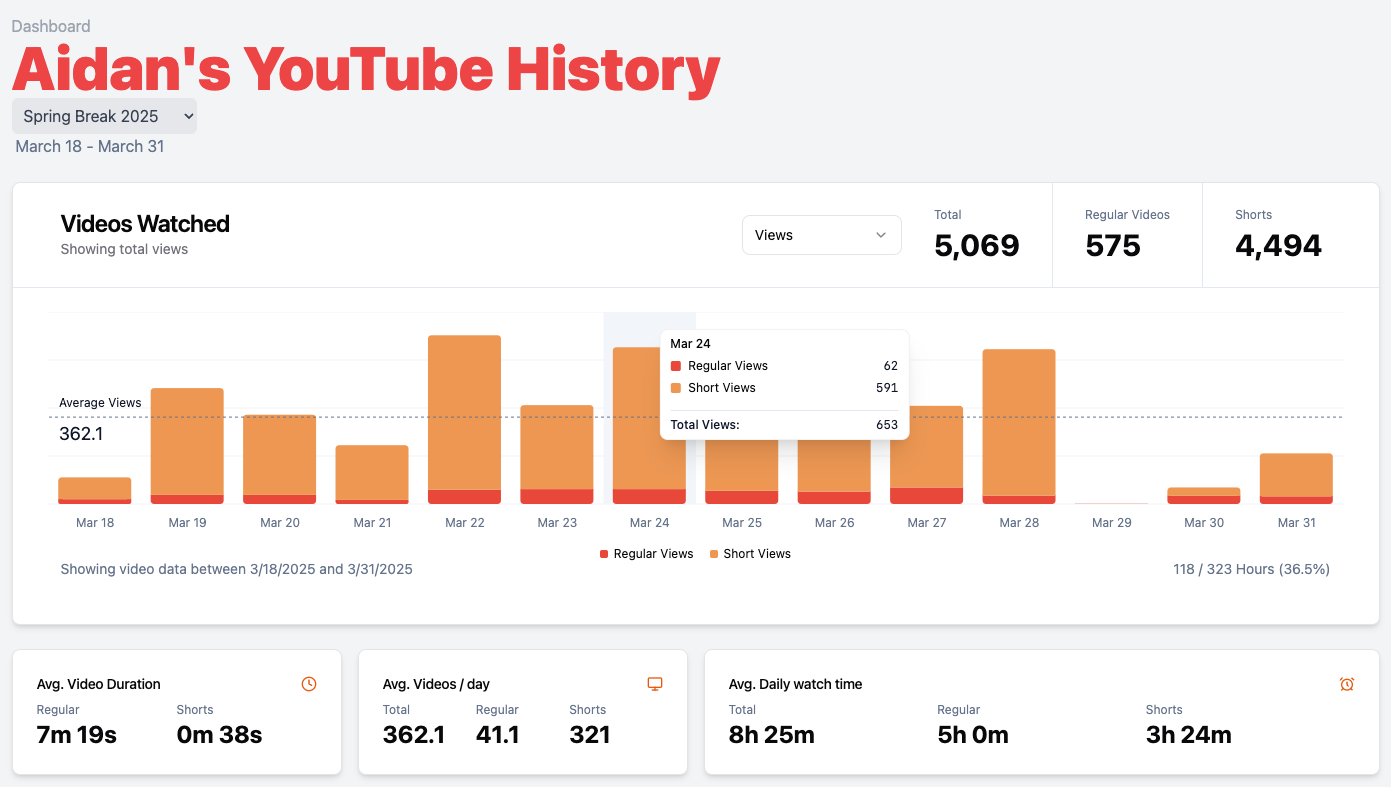
Comprehensive Watch Time Dashboard
The main dashboard provides a comprehensive overview of my YouTube watch time. See daily watch time, average video duration, daily video counts, and average watch time per day, all at a glance. It’s like a fitness tracker, but for my YouTube consumption!
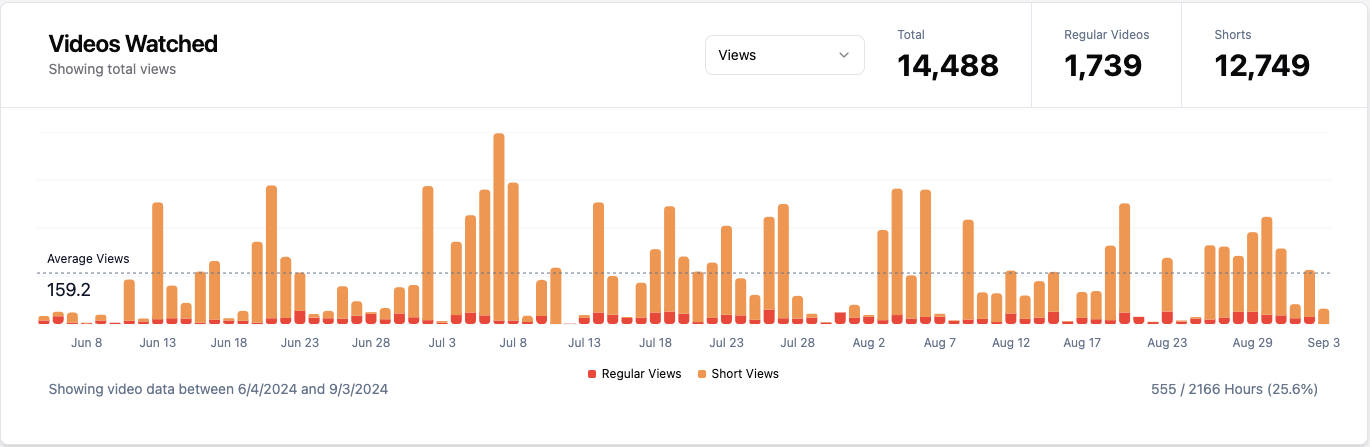
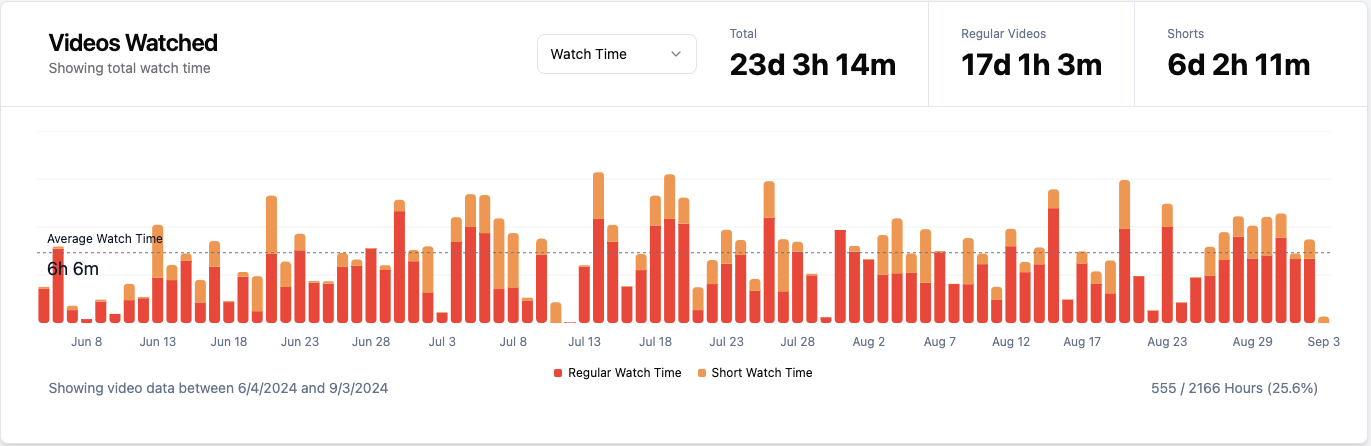
This was Summer 2024 … YIKES 😬
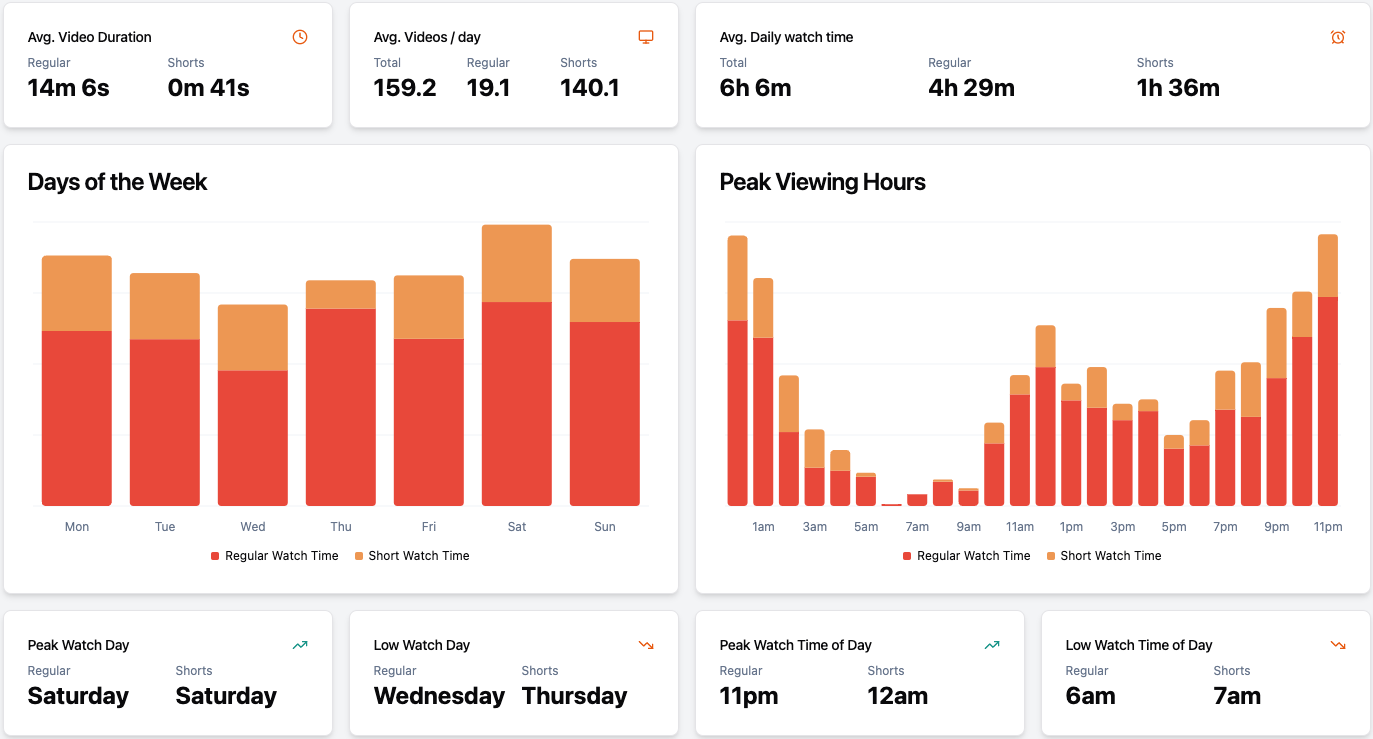
Time-Based Viewing Pattern Analysis
Next, the dashboard analyzes viewing patterns across days of the week and hours of the day. Here I can discover my peak viewing times for both regular videos and YouTube Shorts.
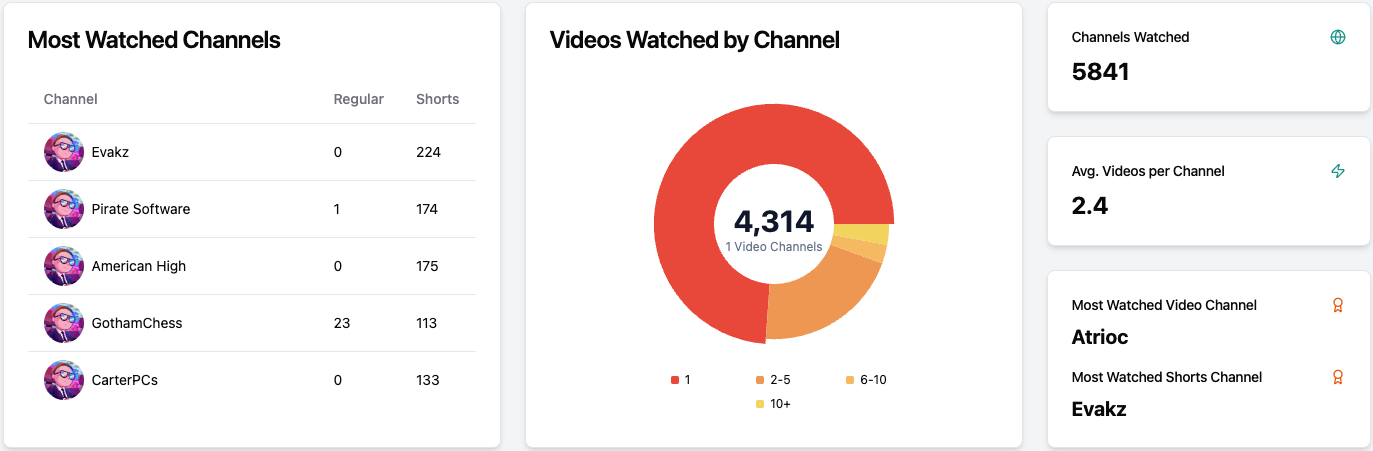
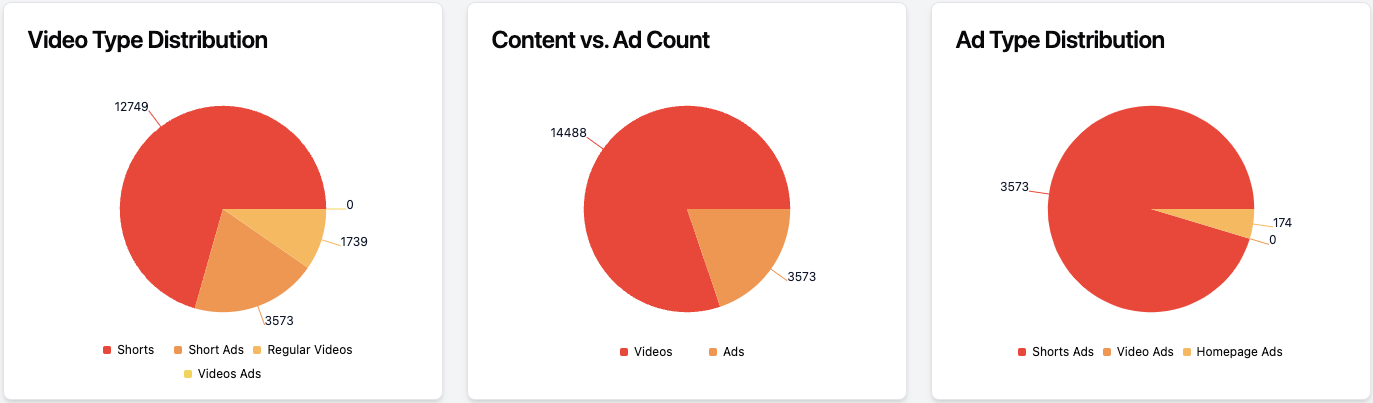
Content Consumption Breakdown
The dashboard also provides a visual breakdown of my content consumption, showing watch time for short-form vs. long-form videos, distribution across channels (identifying most watched channels and video counts per channel), and even content type distribution (videos, Shorts, ads).
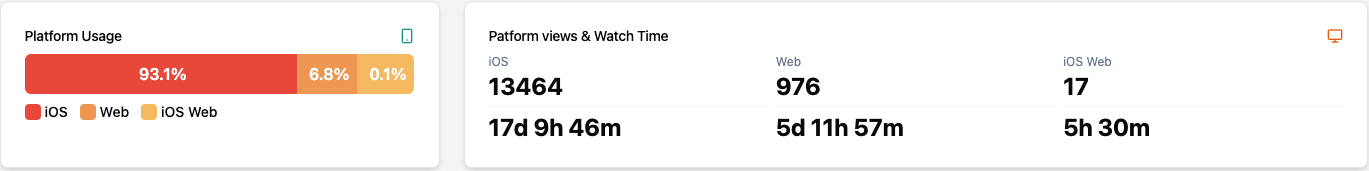
Platform Usage Analysis
Lastly, a small bar chart of device usage. I added it because I saw it was in the data, so might as well include it!
Search Term History
At the very bottom of the page, I also included a list of all YouTube terms I searched for during the analyzed period. This provides a text-based insight into what topics and videos I was actively seeking out.
Built with React, Recharts, and a
The YouTube Watch History Insights dashboard is built using React 2 for the frontend and Recharts 3 for creating all the charts and insightful visualizations. And to make the charts as effective and visually appealing as possible, I even leveraged LLMs like Claude to help design the graphs and optimize the Recharts 3 configurations!
Go explore the data here: schmitigal.com/mychronicyoutubeaddictionChallenges and Learnings:
Turning a massive JSON dump into a user-friendly dashboard was definitely a journey! Here are some key challenges and learnings:
It took me a couple of good tries to get working
jqcommand that extracts all the neccessary values from the obfuscated data. And then I forgot to write it down and needed to recreate it again. I gained some more experience with web scraping techniques, and complex data extraction to optimize the data for visualization.Designing a dashboard that effectively communicates complex viewing patterns and insights, required careful consideration of chart types, visual clarity, and interactivity. I really liked looking through the Recharts 3 library documentation to see what is possible and experimenting with LLM assistance to optimize graph configurations and create data-driven visual storytelling. I definitely expanded my knowledge on enhanced data visualization design skills.
Key Contributions: Data Analyst & Visualization Enthusiast
As the solo developer and data analyst for YouTube Watch History Insights, my key contributions were:
- Conceived, designed, and developed the entire YouTube Watch History Insights website as a personal data exploration project, demonstrating data analysis and visualization skills.
- Extracted YouTube viewing history data from personal Google accounts using network data viewing and parsing.
- Developed data processing and parsing pipelines using JQ to transform raw, unstructured data into analyzable datasets.
- Designed and implemented a comprehensive, interactive dashboard using React and Recharts to visualize a wide range of YouTube viewing statistics and trends.
- Leveraged LLMs (like Claude) to optimize graph design and Recharts configurations for effective and visually appealing data presentation.